Cut Fabric Costs by Optimizing ERP Production Scheduling
Fabric production costs hide in unbalanced machines, idle shifts and excess inventory. ERP scheduling optimization cuts these waste streams by matching output to demand.

What this covers
- Idle machines and unbalanced shifts cost more than raw material waste.
- Overproduction hides in batch sizing and unlinked demand planning.
- Material shortages and quality holds create hidden downtime between operations.
- Worker attendance and machine availability must align in the same schedule.
- Small changes in setup times and batch sizes move costs faster than big changes in pricing.
Fabric production costs are not just the price of yarn or the wage bill. They hide in the gaps between machines running at different speeds, in shifts where operators wait for material, and in batches that finish before the next order is ready. These inefficiencies add up faster than raw material costs or labour rates. The solution is not tighter budgets or more supervision—it is aligning machine load, worker shifts, and material availability in the same system.
ERP production scheduling does this by turning batch cards, shift plans, and material requisitions into a single sequence. When a dyehouse finishes a batch, the stitching line has the right fabric. When a loom breaks down, the next shift is already assigned. When a customer order changes, the schedule adjusts without scrapping half-finished rolls. The result is less idle time, less overproduction, and less money tied up in work in progress.
This article explains how to spot these hidden costs in your own plant, then shows how to cut them by linking scheduling to real capacity—machines, operators, and material—rather than to theoretical output.
Why fabric production costs rise even when prices stay flat
Fabric production costs do not move in lockstep with yarn prices or wage rates. They rise when machines run at different speeds, when operators wait for material, or when batches finish early and sit in storage. These costs remain invisible until they appear as scrap, rework, or storage fees months later.
For example, a 3% scrap rate on 50,000 metres of fabric per month results in 1,500 metres of scrap at £2.50 per metre—£45,000 annually before accounting for wasted labour and machine time. The true cost lies in the unplanned downtime that generates scrap.
Overproduction also hides in batch sizing. A 2,000-kilo dyehouse batch for a 1,500-kilo order leaves 500 kilos unsold, incurring storage, handling, and obsolescence costs. In a plant with three dyehouses running mismatched batch sizes, these inefficiencies multiply.
ERP production scheduling reduces these costs by aligning batch sizes with demand—not machine capacity. Instead of running a loom for eight hours to fill a batch, it operates for seven hours and 45 minutes, eliminating idle time. The solution lies in scheduling based on real constraints—machine speeds, operator shifts, and material availability—rather than theoretical output.
How machine speeds create hidden costs between operations
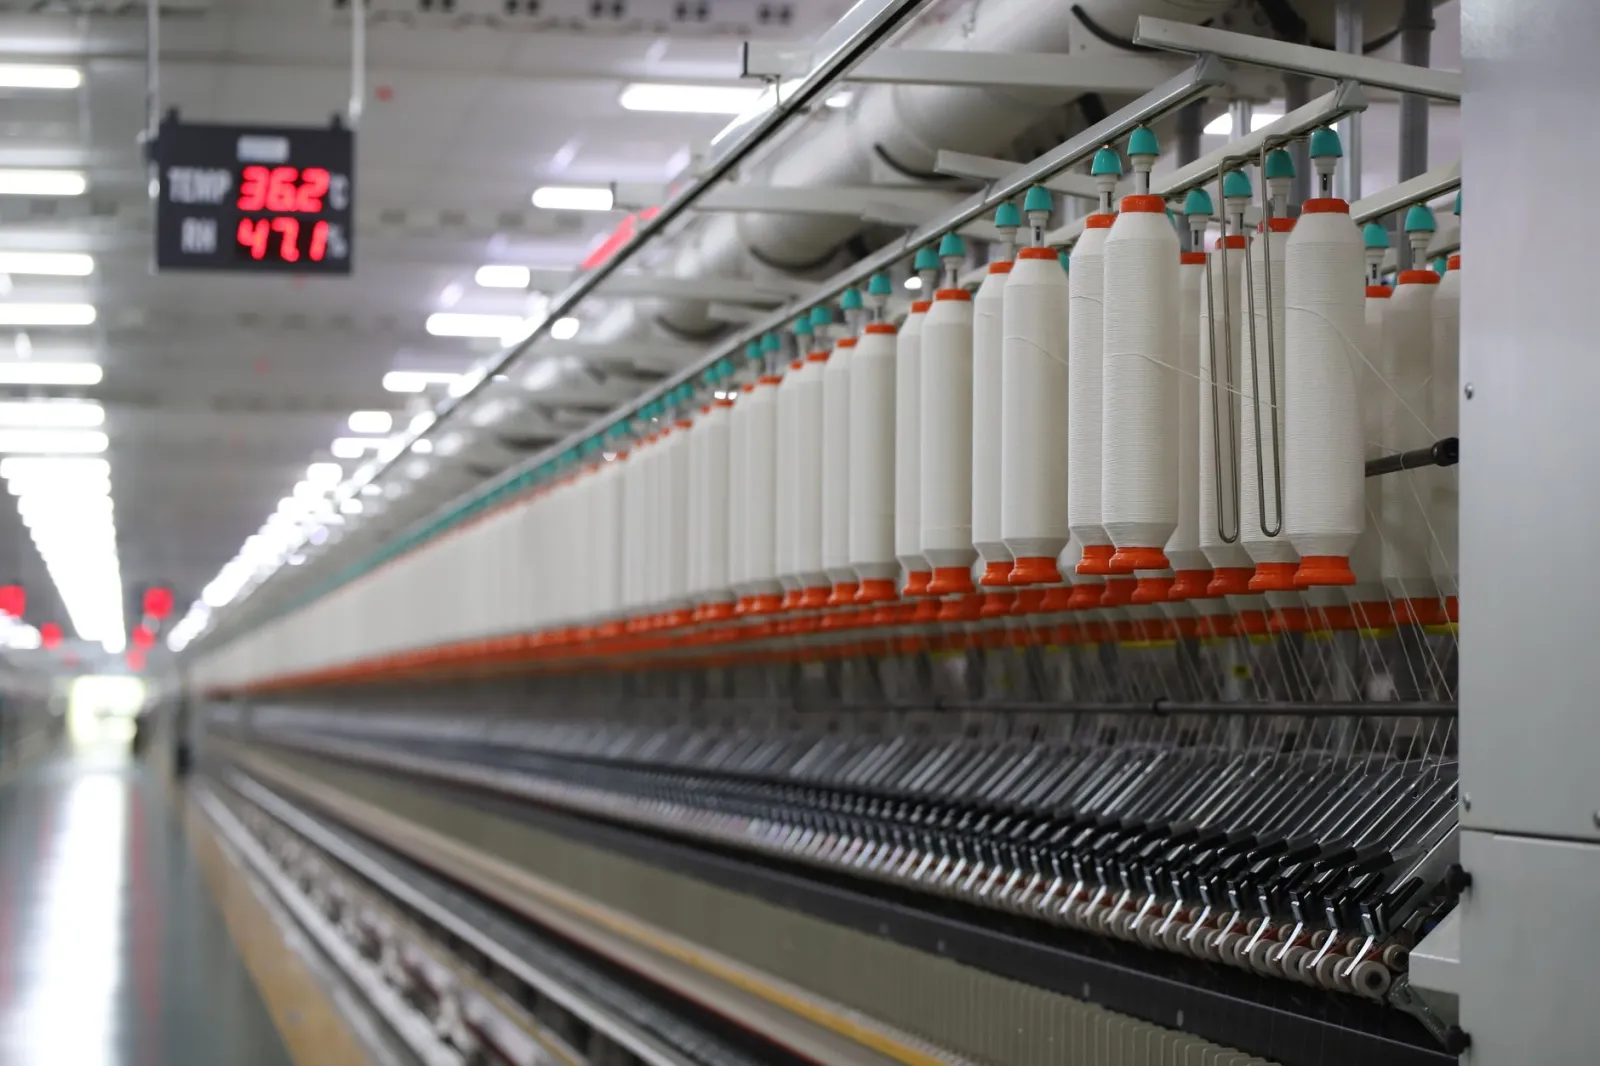
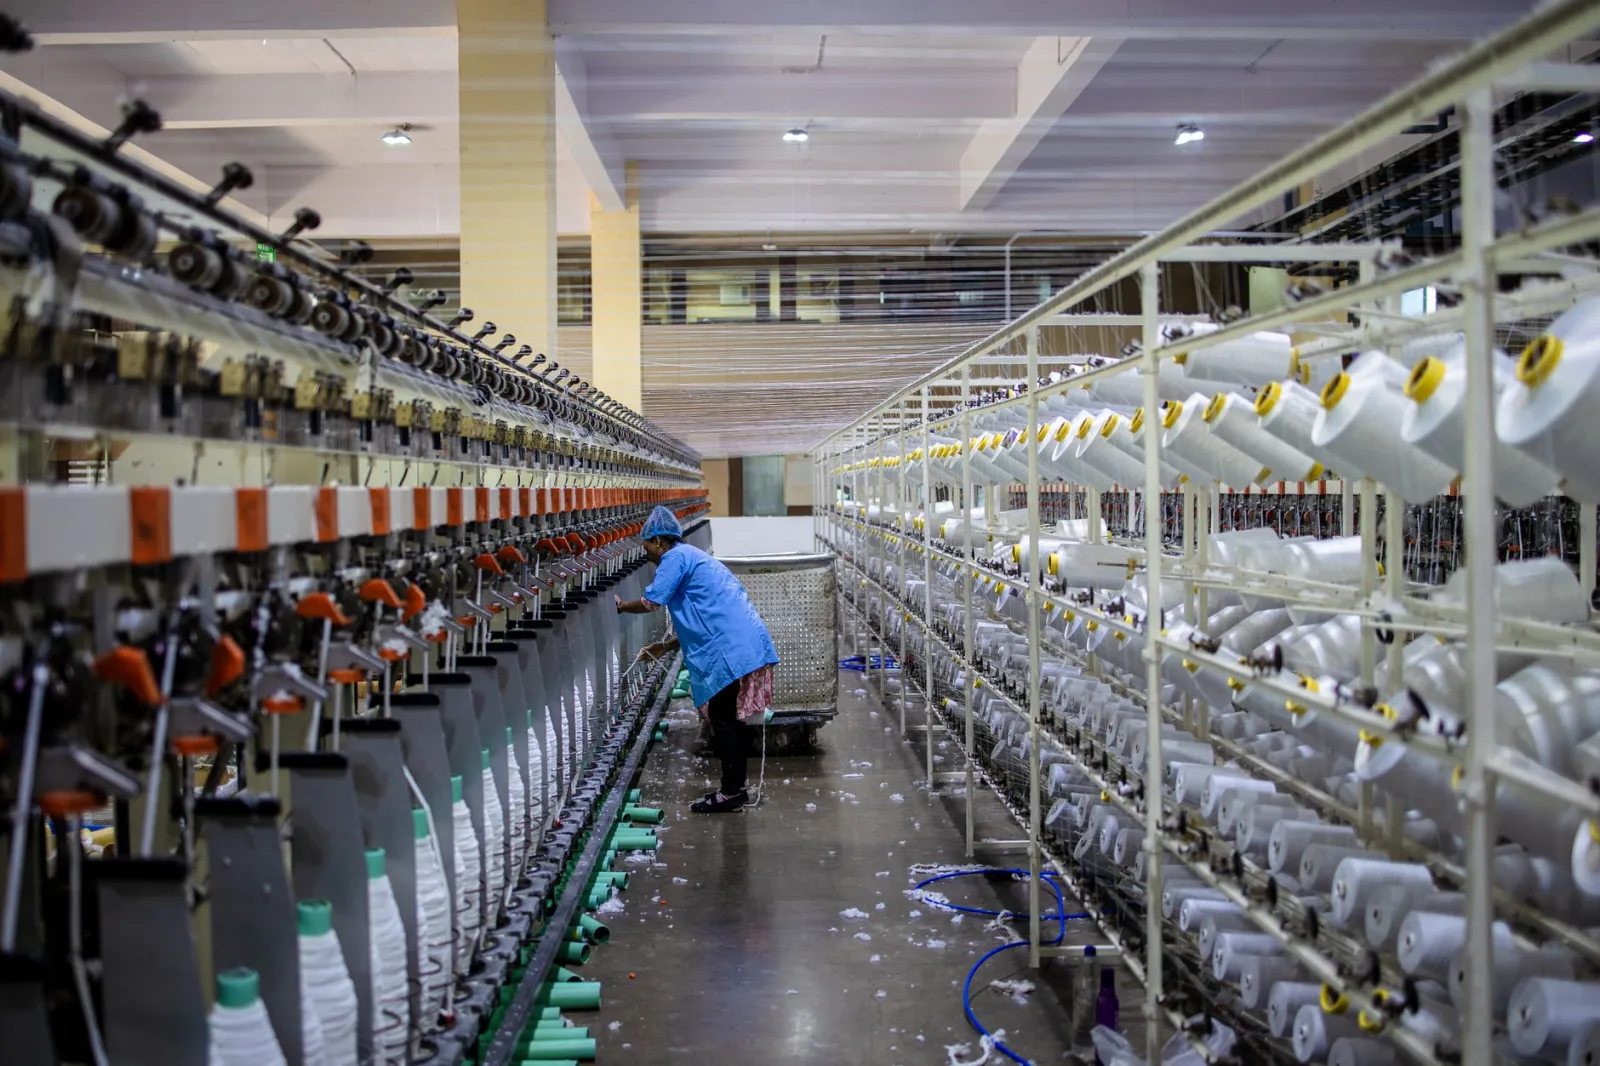
Fabric production lines are not balanced. A loom may weave 100 metres per hour, but the dyehouse can only process 60 metres per hour. The stitching line takes 80 metres per hour. The result is bottlenecks, idle time, and excess inventory.
For example, if your dyehouse runs at 60 metres per hour but your loom runs at 100 metres per hour, the loom will finish its batch before the dyehouse. This creates either idle time for the loom or overtime for the dyehouse—both costly. The true cost is lost output from the bottleneck operation, such as the loom’s potential 200 extra metres in those two hours.
ERP scheduling addresses this by aligning machine output to the slowest linked operation. If the dyehouse is the bottleneck, the loom and stitching line adjust to match its speed. This eliminates idle time, overtime, and excess inventory.
To identify inefficiencies, review a report of actual vs. planned output per machine per shift over the last three months. Gaps between actual and planned output reveal hidden costs.
Why shift plans and machine availability rarely match
Shift plans assume machines run 24/7, but in reality, they do not. Maintenance, power cuts, and material shortages create gaps between planned and actual running time. When unaccounted for, operators and machines wait, wasting time and resources.
For example, a loom breakdown for an hour leaves an operator idle unless reassigned. If it occurs at shift-end, the next operator finds no work. The cost includes lost output and paid labour for idle time—over a year, these gaps total weeks of wasted time.
ERP scheduling links machine availability to shift plans. When a machine is down, operators are reassigned; late material triggers schedule adjustments. The key is treating machine availability as a variable, not a constant. If a loom runs at 90% capacity due to breakdowns, the schedule reflects that—no overproduction, no idle shifts.
Check your plant: compare planned vs. actual machine hours over the last month. A difference of more than 5% signals unplanned downtime, costing more than repairs—it wastes labour and material while machines sit idle.
How material shortages create downtime between operations
Material shortages do not just delay production—they create hidden costs in storage, handling, and rework. If a dyehouse finishes a batch but the stitching line does not have the right fabric, the batch may sit for days before being moved. During that time, it takes up space, requires handling, and risks damage or obsolescence.
For instance, say your stitching line needs 1,000 metres of fabric per week, but the dyehouse delivers in batches of 2,000 metres every two weeks. That means 1,000 metres sits in storage for a week before being used. The cost is not just the storage space, but the potential for damage, misplacement, or even expiry if the fabric has a shelf life. In a plant with multiple dyehouses and stitching lines, these inefficiencies multiply.
ERP scheduling links material availability to production plans. When a dyehouse finishes a batch, the system checks which stitching line needs it next. If the material is not ready, the schedule adjusts to avoid idle time. The result is no excess inventory, no storage costs, and no delays between operations.
To identify this in your plant, track the time between when a batch leaves one operation and when it arrives at the next. If the gap is more than 24 hours, you have unplanned storage costs. If the gap varies by more than 10 per cent from week to week, you have scheduling inefficiencies.
What happens when batch sizes do not match demand
Batch sizing is a trade-off. Small batches reduce overproduction but increase setup time. Large batches cut setup costs but create excess inventory. The optimal batch size depends on demand, not machine capacity.
For example, if your loom produces 100 metres per hour and your minimum setup time is 30 minutes, a batch of 50 metres may be efficient for small orders. But if demand is 500 metres per week, running five batches of 50 metres costs more in setup time than running one batch of 500 metres. The hidden cost is not the material, but the labour and machine time wasted in frequent setups.
ERP scheduling optimizes batch sizes by linking them to demand. Instead of running batches to fill machine time, it runs them to fill orders. If demand drops, batch sizes shrink. If demand rises, batches grow—but never beyond what the next operation can handle. The result is less overproduction, less scrap, and less money tied up in inventory.
To check your own batch sizing, compare the average batch size against the average order quantity. If batches are consistently larger than orders, you have overproduction. If they are smaller, you have excess setup costs. The optimal size is where the cost of setups equals the cost of holding inventory.
How to align scheduling with real capacity—not theoretical output
Most scheduling systems assume machines run at 100 per cent capacity. In reality, they do not. Maintenance, breakdowns, and material shortages create gaps between planned and actual output. When these gaps are not accounted for, schedules become unrealistic—and costs rise.
For instance, if a loom runs at 90 per cent capacity due to breakdowns, a schedule based on 100 per cent will overproduce by 10 per cent. That extra output may sit in storage for weeks before being sold off at a discount. The cost is not just the material, but the labour and machine time wasted producing it.
ERP scheduling aligns with real capacity by treating machine availability as a variable. If a loom runs at 90 per cent, the schedule reflects that—no overproduction, no idle time. The key is using actual data, not theoretical output, to set batch sizes and shift plans.
To implement this in your plant, start by tracking actual machine running time over the last three months. Compare it to planned output. Where the gap is largest, adjust the schedule to match real capacity. Use Facteno’s production module to link machine availability to shift plans and material requisitions.
What to do next week: three steps to test scheduling changes
Testing scheduling changes does not require a full system overhaul. Start with these three steps:
- Pull a report of actual machine running time per shift over the last month. Compare it to planned output. Where the gap is largest, note the operation and the reason (breakdowns, material shortages, operator delays).
- Adjust the schedule for one operation to match real capacity. For example, if a loom runs at 90 per cent, reduce its planned output by 10 per cent. Track the impact on idle time and overproduction over the next two weeks.
- Link material requisitions to production schedules. If a dyehouse finishes a batch but the stitching line lacks fabric, adjust the schedule to avoid delays. Use Facteno’s purchase module to track material availability in real time.
These steps require aligning existing data—no new software is needed. If you use Facteno, the production module already links machines, shifts, and material. Start there, then expand.
| Cost driver | When it lands | What moves it |
|---|---|---|
| Machine idle time | During shift handoffs, breakdowns, or material shortages | Actual running time vs. planned output |
| Overproduction | After batches finish before next order is ready | Batch size vs. demand forecast |
| Storage costs | Between operations or after demand drops | Time between batch completion and next use |
| Setup time | Between batches or orders | Batch size and machine changeover speed |
| Labour downtime | When operators wait for material or machines | Shift plan vs. actual material arrival |
| Scrap and rework | After quality holds or machine failures | Defect rate per operation and reprocessing time |
Related reading: Cut Fabric Costs by Optimizing ERP Work Orders.
Frequently asked
How do we know if our batch sizes are too large or too small?
What if our machines run at different speeds?
How do we handle material shortages in the schedule?
What if our operators are not available when machines are ready?
How do we measure the impact of scheduling changes?
Everything above is how Facteno actually behaves
Ask for demo access and we will walk you through a full plant with four months of documents, so you can check the numbers yourself.