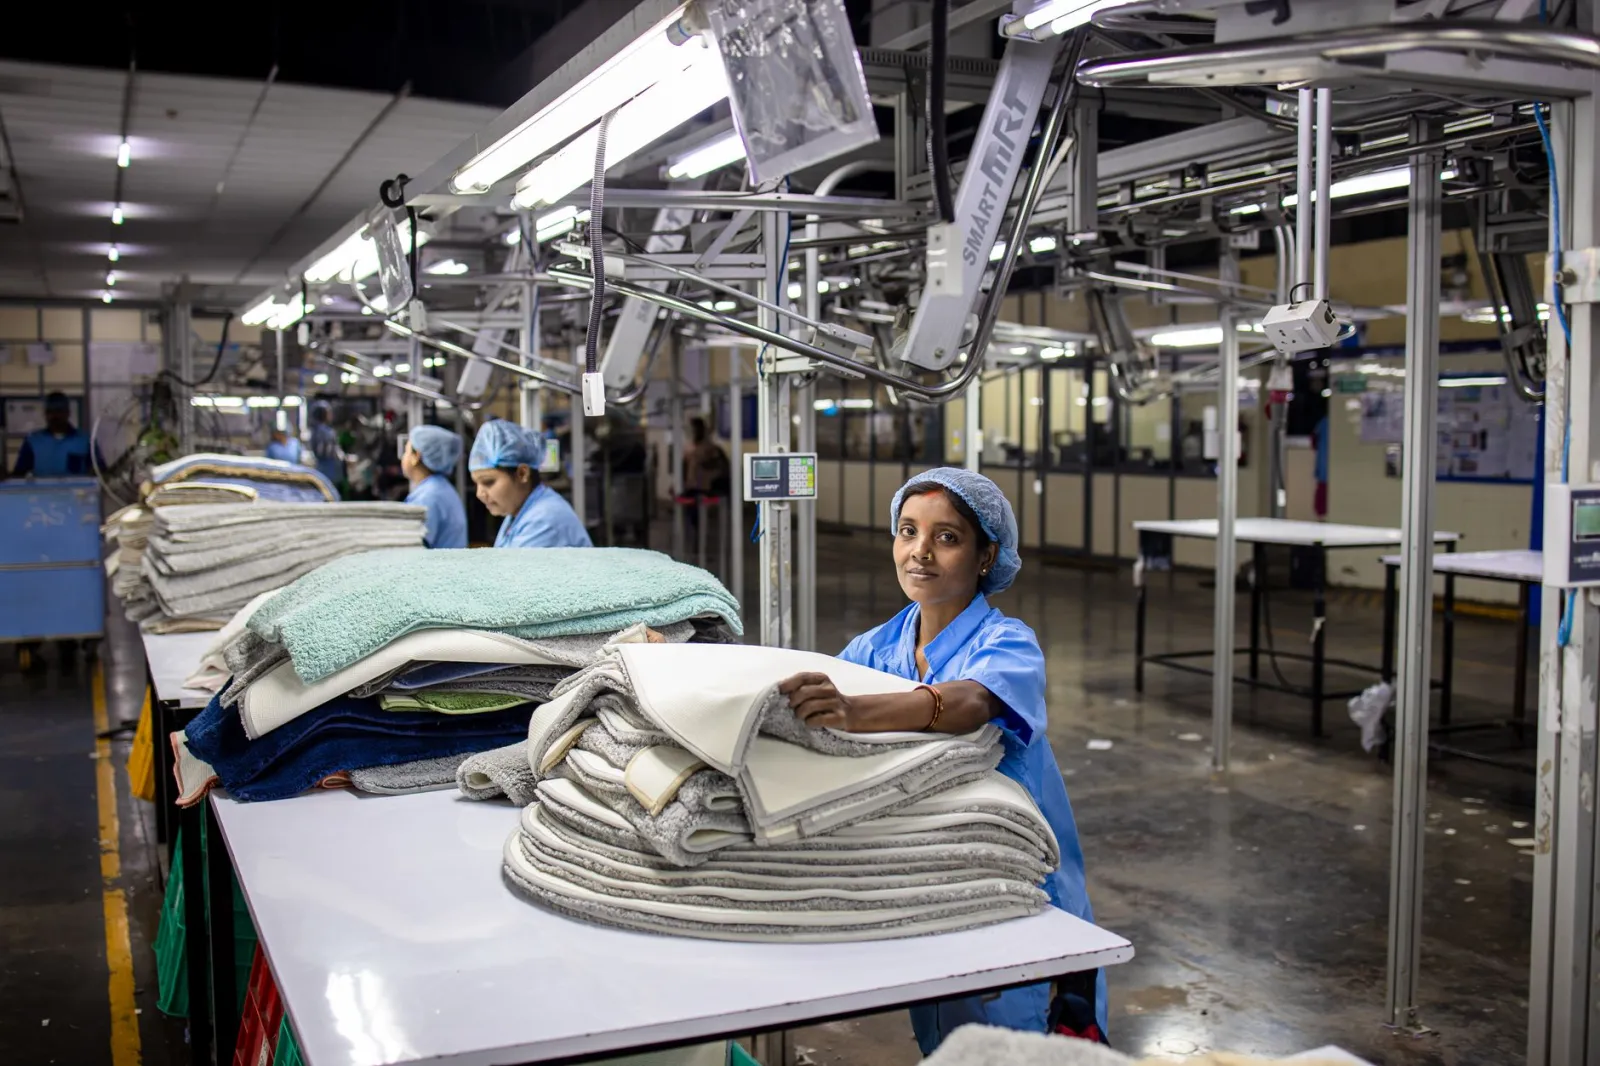
How to Cut Fabric Production Lead Time Using ERP Data
Fabric production lead times shrink when you track the right data in your ERP, not when you guess which stage is slowest.
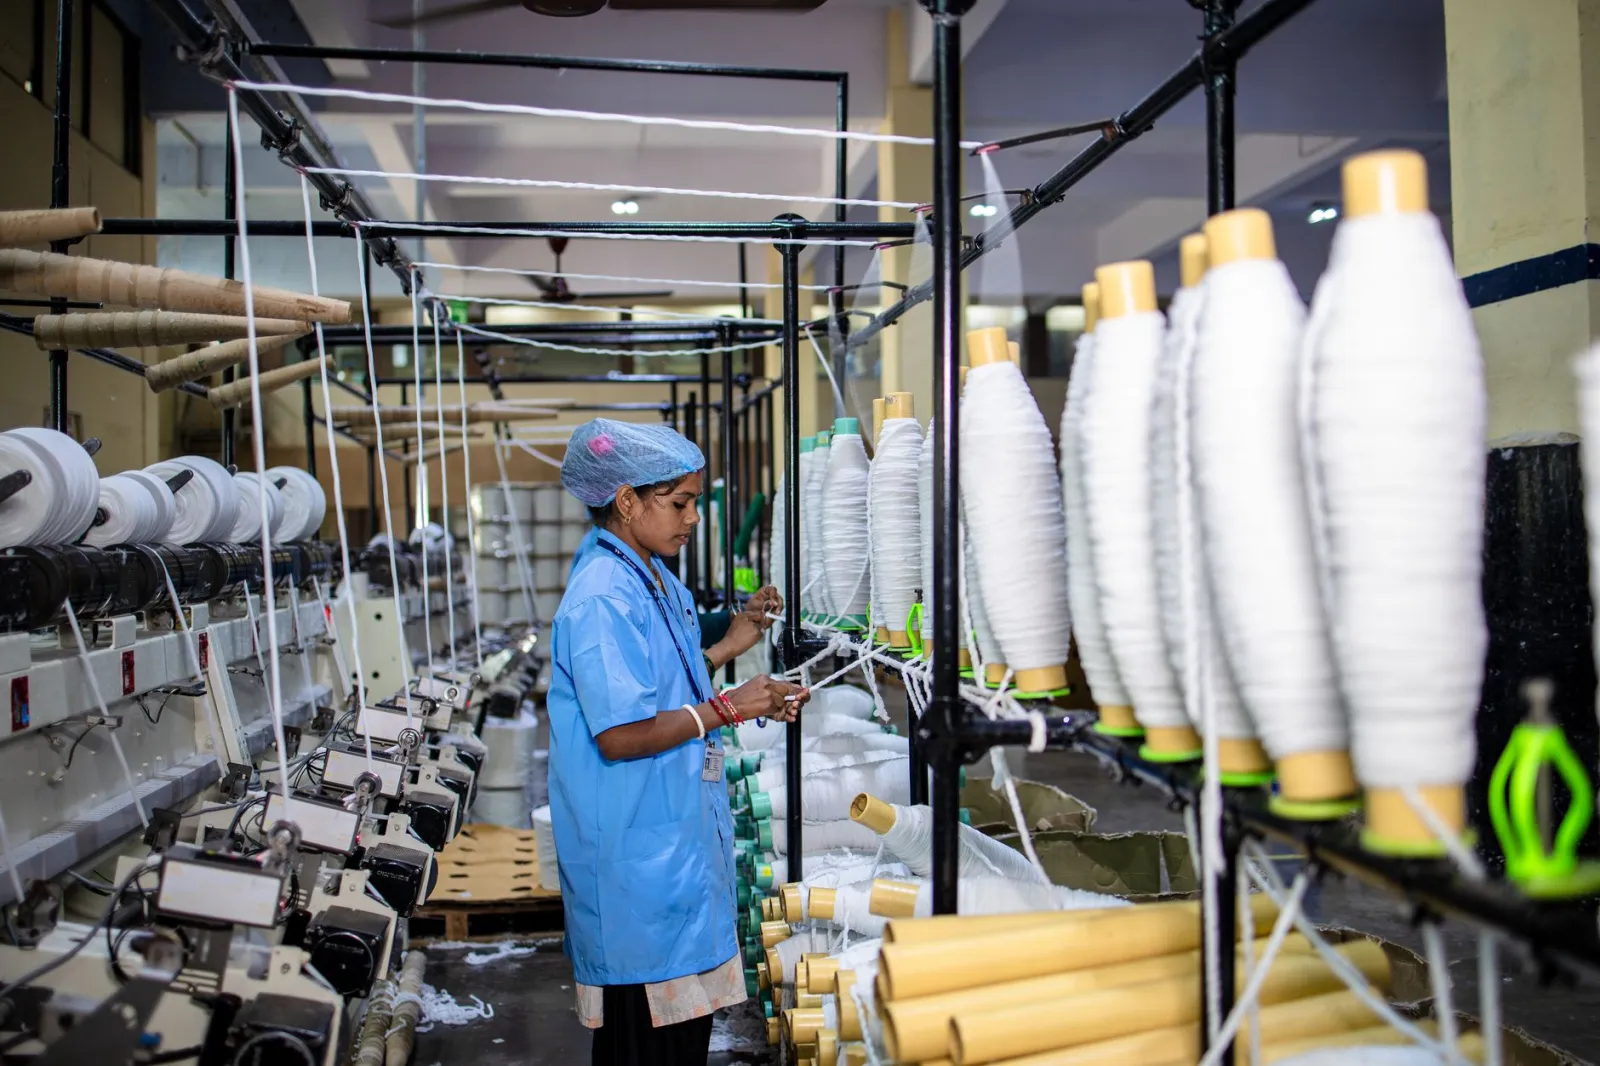
What this covers
- Lead time cuts start with ERP data, not spreadsheets or gut instinct.
- Bottlenecks hide in three places: material flow, machine loading and approval chains.
- A 30% reduction means targeting the 20% of stages that cause 80% of delays.
- Quality checks add lead time—ERP shows where they can be streamlined without risk.
- The first step is measuring what you already track, not installing new sensors.
Your fabric lead times are longer than they need to be
You know the numbers: a customer orders 5,000 metres of dyed polyester, your lead time promise is 14 days, but the invoice arrives 21 days later. The difference isn’t just lost sales—it’s overtime, rushed shifts and fabric sitting in stores while you chase missing approvals. The problem isn’t the machines or the workers; it’s that you’re measuring lead time by when the order *starts*, not when the *bottleneck* starts.
ERP data doesn’t magically cut lead times—it exposes which stages are actually slowing you down. The rest is adjusting those stages, one at a time, without guessing.
What does ‘lead time’ actually mean in fabric production?
Lead time in textile manufacturing isn’t a single number. It’s three overlapping cycles:
- The time from order confirmation to when the first loom starts weaving (order-to-start).
- The time from weaving to when the last packed roll leaves the warehouse (start-to-finish).
- The time from order confirmation to when the customer signs for delivery (promised-to-actual).
Most plants track only the last of these—because it’s tied to the invoice—but the first two are where delays hide. For example:
Say your promised lead time is 14 days, but your order-to-start average is 7 days. That means half your delay comes from before the fabric even hits the loom. The rest is in dyeing, finishing or packing. ERP shows which half is worse.
Facteno’s production module ties these cycles to actual machine output, not estimated capacity. If your dyehouse runs at 60% efficiency, the ERP will show that as a 4-day delay on every order—even if the loom itself is idle.
How do you find the stages that add the most delay?
Start with the ERP’s actual lead time data, not your promised lead time. In Facteno, the Business Control Centre shows:
- The time from order release to first production (order-to-start).
- The time from first production to final inspection (start-to-finish).
- The time from final inspection to dispatch (finish-to-delivery).
Compare these to your promised lead time. The gap isn’t just “slow”—it’s a sum of:
- Waiting for material releases (e.g., yarn not arriving from the spinner).
- Machine downtime that isn’t logged as breakdowns (e.g., “cleaning” that takes 2 hours).
- Approval bottlenecks (e.g., a quality check that sits for 3 days because the inspector is on leave).
- Rework loops (e.g., a dye batch rejected twice before passing).
Example: If your promised lead time is 14 days but your ERP shows:
- Order-to-start: 5 days (2 days waiting for yarn, 3 days for loom setup).
- Start-to-finish: 10 days (4 days dyeing, 3 days finishing, 3 days packing).
- Finish-to-delivery: 2 days (1 day inspection, 1 day dispatch).
Your actual lead time is 17 days—but the real bottleneck is the 5-day order-to-start, not the machines. Facteno’s purchase module will show you that the yarn delay is caused by late supplier GRNs, not your weaving speed.
Which bottlenecks should you fix first?
Not all delays are equal. A 2-day delay in dyeing affects every order; a 1-day delay in packing affects only the last batch. Prioritise stages where:
- The delay is consistent across orders (e.g., every dye batch takes 4 days, not 3).
- The delay is growing over time (e.g., loom setup time rose from 1 hour to 2 hours last month).
- The delay is hidden in approvals or rework (e.g., quality checks that aren’t logged in the ERP).
Example: If your finishing stage shows a 3-day delay but your dyeing stage shows 4 days, fixing dyeing first saves more time. However, if dyeing’s 4-day delay is caused by a single machine that’s only used 20% of the time, the real fix is to rebalance your OEE—not just speed up the process.
Facteno’s reports module lets you sort delays by cost impact. A 1-day delay in dyeing might cost $2,000 in tied-up fabric, while a 30-minute delay in packing costs $200. Fix the $2,000 first.
How do you measure the real cost of a delay?
Lead time isn’t just about days—it’s about money tied up in:
- Fabric in process (storage, interest, spoilage risk).
- Labour paid for idle time (e.g., a loom operator waiting for yarn).
- Utility costs for unused machines (e.g., dyehouse running at half capacity).
- Opportunity cost (e.g., a customer who switched suppliers while you were delayed).
Example: Say your scrap rate is 3% and your fabric costs $5 per metre. A 5-day delay in dyeing means:
- 1,500 metres of fabric sit unused for 5 days (storage cost: $7,500 × 0.05% daily interest = $375).
- 2 operators idle for 5 days at $20/hour = $800.
- Dyehouse utilities at $10/hour for 5 days = $400.
- Total hidden cost per delayed order: $1,575.
Facteno’s product costing module ties these costs to each stage. If dyeing adds $1,575 per order, reducing its delay by 2 days saves $630 per order—without touching the loom.
| Cost driver | When it lands | What moves it |
|---|---|---|
| Fabric storage | Day 1 of delay | Warehouse capacity, interest rates, spoilage risk |
| Labour idle time | Day 1 of delay | Shift wages, operator skills, machine loading |
| Utility costs | Day 1 of delay | Energy tariffs, machine efficiency, shift hours |
| Opportunity cost | Day of customer complaint | Customer retention rate, competitor lead times |
Most plants overlook opportunity cost because it’s hard to measure. Facteno’s sales module tracks how many orders you lose to delays—if 10% of quotes turn into competitor sales, that’s a direct cost of lost revenue.
What trade-offs do you avoid when cutting lead time?
Reducing lead time often means:
- Skipping quality checks to speed up finishing.
- Running machines longer to meet deadlines.
- Hiring temporary labour for peak periods.
These fixes work until they don’t. Skipping checks increases scrap; longer shifts raise fatigue; temps add training costs. The ERP shows where these trade-offs hit:
- If your scrap rate rises when you cut inspection time, the ERP’s quality module will log the defect patterns.
- If overtime hours exceed 20% of payroll, Facteno’s payroll module flags it as unsustainable.
- If temp labour costs exceed $500 per hire, the costing module shows it as a one-off expense, not a lead-time fix.
Example: A plant cut dyeing time by 1 day to meet lead times, but scrap rose from 2% to 4%. The ERP’s defect logs showed the rush caused colour variation. The real fix was adjusting dye bath temperatures—not working faster.
How do you keep lead times down after the first cut?
Lead time reductions don’t stick if you only fix one stage. Example:
- You cut dyeing time by 1 day, but packing now becomes the bottleneck.
- You hire more packers, but their training adds 2 days to the next order.
- You automate loom setup, but the new system requires approvals that add 3 days.
Facteno’s Business Control Centre tracks these second-order effects in real time. The key is:
- Setting a maximum lead time per stage (e.g., “dyeing must not exceed 3 days”).
- Logging why a stage hits its limit (e.g., “dyehouse at 110% capacity”).
- Adjusting before the next order starts (e.g., moving a batch to a less busy dyehouse).
Example: If your ERP shows dyeing at 110% capacity for 3 days, the fix isn’t working harder—it’s adding a second dyehouse or shifting orders to off-peak hours. Facteno’s production module lets you simulate both options before committing.
What’s the first step you take next week?
Don’t start with spreadsheets or guesswork. In Facteno:
- Run the Production Lead Time Report (under Reports) for the past 3 months. Note the top 3 stages with the highest delays.
- Check the Material Flow Report to see if delays are caused by missing GRNs or late supplier deliveries.
- Review the Quality Defect Log for stages where rework is adding days (e.g., dyeing, finishing).
- Set a maximum allowable delay for each stage (e.g., “dyeing: 3 days, finishing: 2 days”).
- Assign one person to track these delays daily—no approvals, no guesswork.
The goal isn’t to hit a 30% reduction immediately. It’s to prove which stages are actually slowing you down—and then fix the worst one. The rest follows.
Frequently asked
Can I cut lead time without buying new machines?
What if my biggest delay is caused by a supplier?
Will cutting lead time increase scrap or defects?
How do I know if my lead time cuts are sustainable?
What if my plant is already running at 100% capacity?
Everything above is how Facteno actually behaves
Ask for demo access and we will walk you through a full plant with four months of documents, so you can check the numbers yourself.